Disclaimer:
Please be aware that the content herein has not been peer reviewed. It consists of personal reflections, insights, and learnings of the contributor(s). It may not be exhaustive, nor does it aim to be authoritative knowledge.
Overview
Prepared by (Name of the experimenter)
Cristhian Parra
On date (Day/Month/Year)
26/8/2024
Current status of experimental activity
Completed
What portfolio does this activity correspond to? If any
Building innovation capacities
What is the frontier challenge does this activity responds to?
Public and Social Innovation
What is the learning question(from your action learning plan) is this activity related to?
To what extent can we improve the access to better food in vulnerable populations? To what extend increasing local access will result in improvements in the diets of vulnerable families? How can we apply agile R&D methods to develop and test programs with the public sector?
Please categorize the type that best identifies this experimental activity:
Fully Randomised (RCTs, etc.)
Which sector are you partnering with for this activity? Please select all that apply
Public Sector
Please list the names of partners mentioned in the previous question:
Presidential Delivery Unit (National Strategy of Innovation), Municipality of San Juan Nepomuceno
Design
What is your hypothesis? IF... THEN....
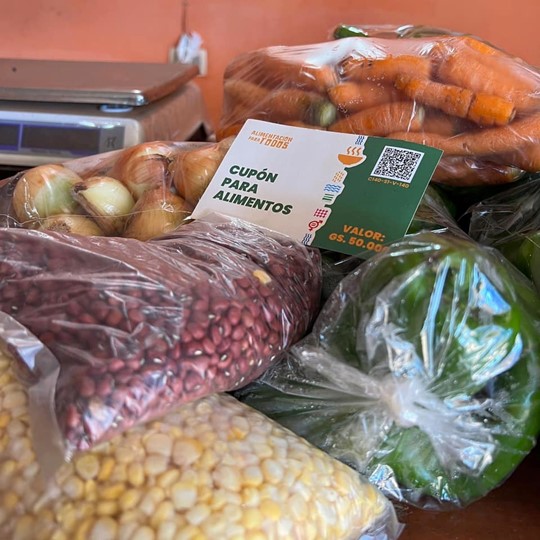
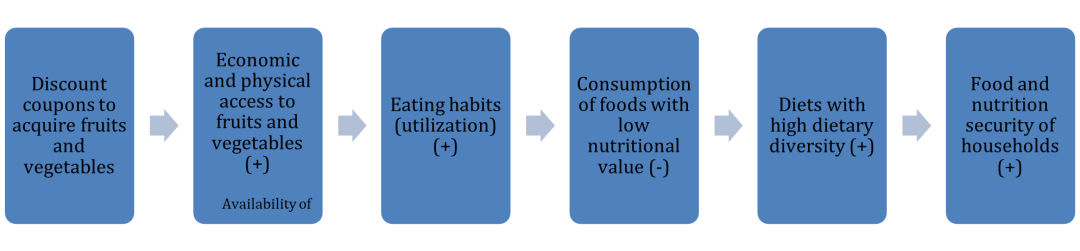
If → a strategy for the provision of food coupons is established so that families in urban and peri-urban areas of San Juan Nepomuceno can exchange them for fruits and vegetables at local agricultural fairs (…) then → these families will improve their economic and physical access to these fresh foods with high nutritional value, and they will improve their indices of dietary diversity.
Does the activity use a control group for comparison?
Yes, a different group entirely
How is the intervention assigned to different groups in your experiment?
Random assignment
Describe which actions will you take to test your hypothesis:
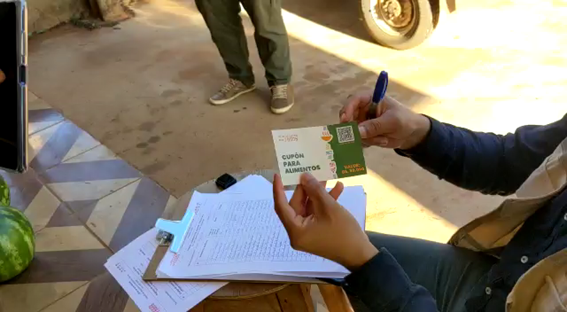
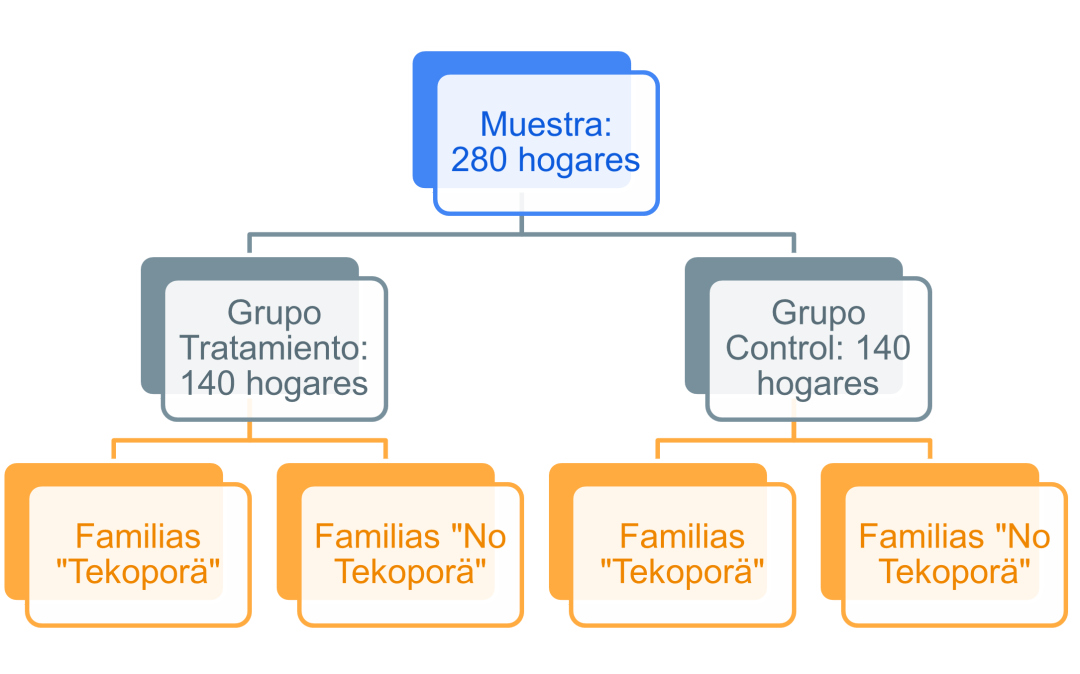
The intervention consists of providing coupons to acquire fruits and vegetables from local fairs to beneficiary and non-beneficiary households of social programs. Each coupon has a value of G. 50,000 (roughly USD 9) and will be provided for 4 weeks to each selected household. In the framework of the intervention, there will be two groups of households that will be selected through the strategy of randomization. The random sample will be made up of a total of 280 households grouped as follows: (1) Treatment group: 140 households that for 4 weeks will receive a coupon per week to acquire fruits and vegetables worth G. 50,000 at local agricultural fairs. (2) Control group: 140 households that will not receive coupons for fruit and vegetables.
What is the unit of analysis of this experimental activity?
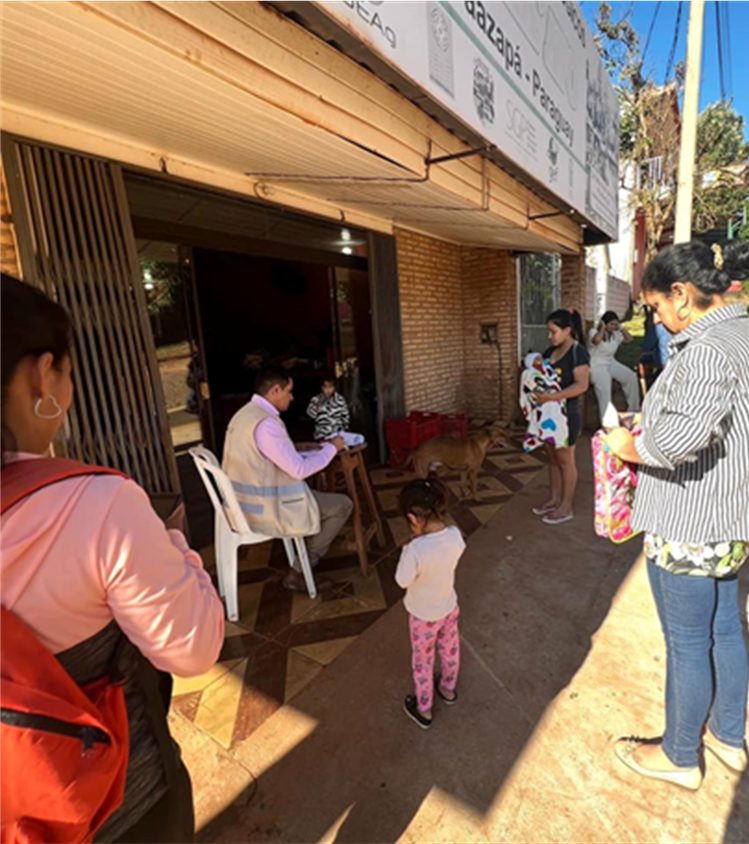
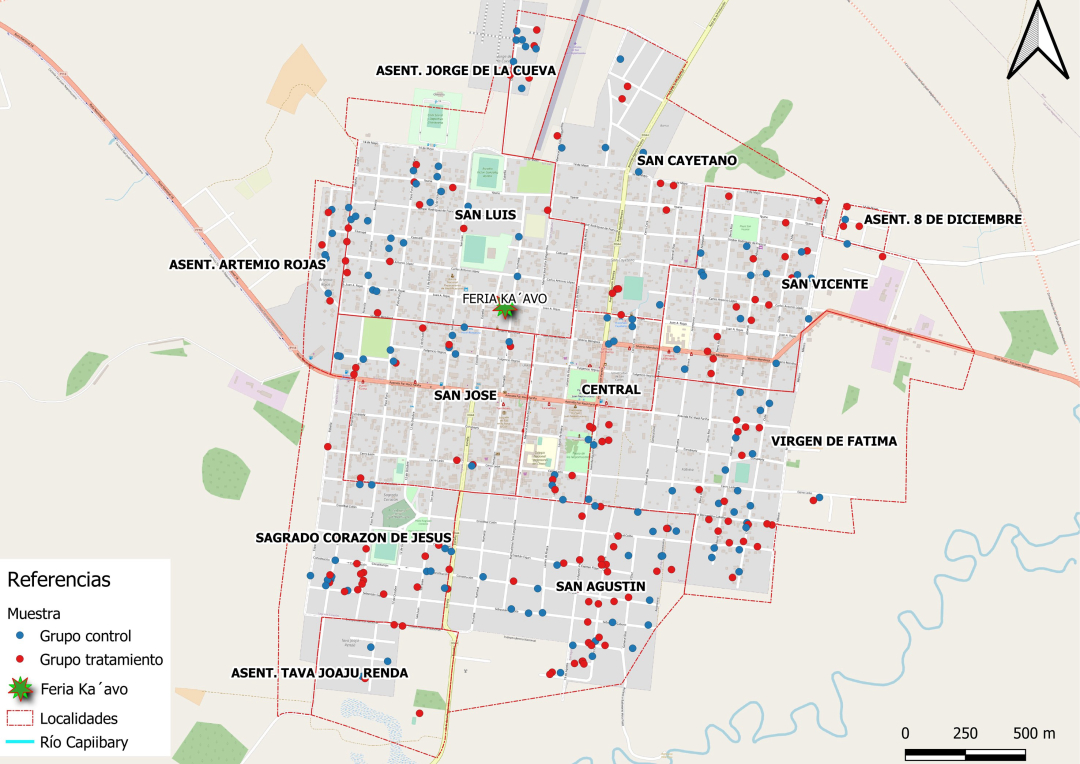
The study unit are households in urban and peri-urban areas of San Juan Nepomuceno, Department of Caazapá. To account for how vulnerability plays a role on this experiment, we divided the whole population in two blocks: (A) families that receive government money transfer aid, (B) families that do not government receive money transfers. Receiving money transfers from the government is used as a proxy for higher vulnerability in this study. In total, 280 households were randomly selected from the urban and peri-urban census map of San Juan Nepomuceno for the cluster A, and from the Government Database of the Tekopora Program for the block(B). Each block was later randomly assigned to either treatment (receive the food stamps for 4 weeks) or control (do not receive the food stamps). All 280 took part of the experiment.
Results
Was the original hypothesis (If.. then) proven or disproven?
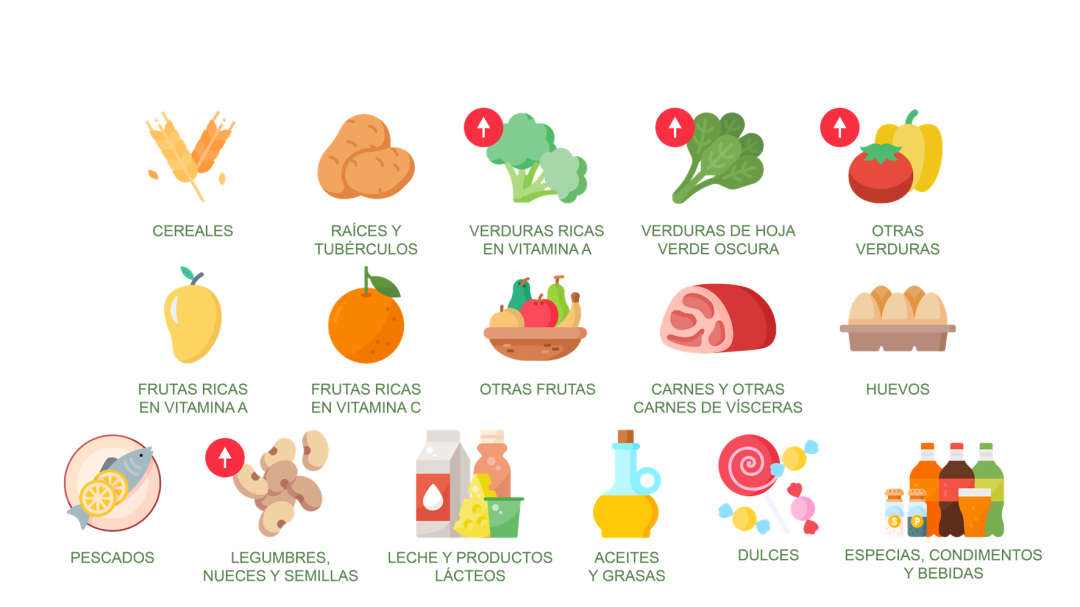
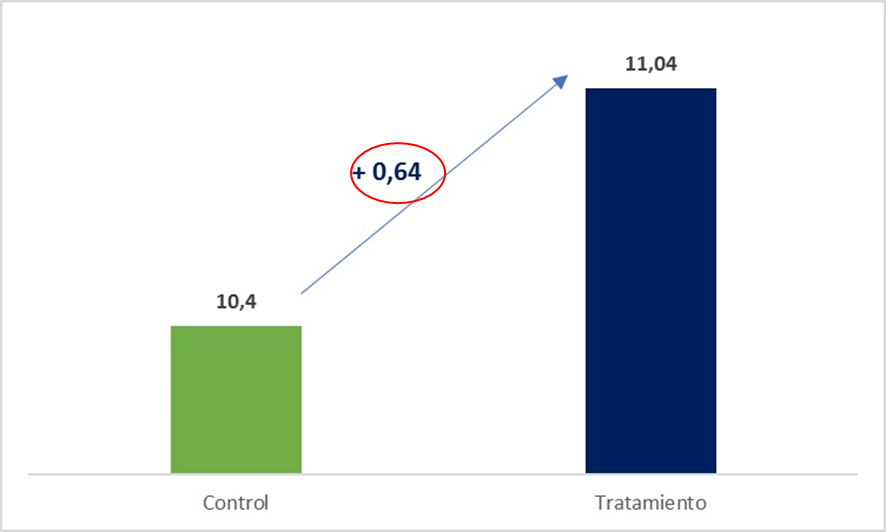
Yes, it was. We measured the impact of our intervention by estimating the Average Treatment Effect (ATE). It is a variable that compares the difference in average outcomes between the treatment and control group, when there is random assignment of the treatment. For the calculation, a cross-sectional regression model is estimated, where the dependent variable is the logarithm of the household's dietary diversity index. The ATE turns out to be the parameter that accompanies the treatment dummy variable. The model shows that, on average, treatment group had +0.64 scored on the HDDS index, and this result is statistically significant. In simpler terms, families that had access to the coupons added, on average, a little more than half of a whole new food group to their diets. Looking into the details, the new groups that were added include: green leaves, vegetables rich in vitamin A, pulse, nuts and seeds.
Do you have observations about the methodology chosen for the experiment? What would you change?
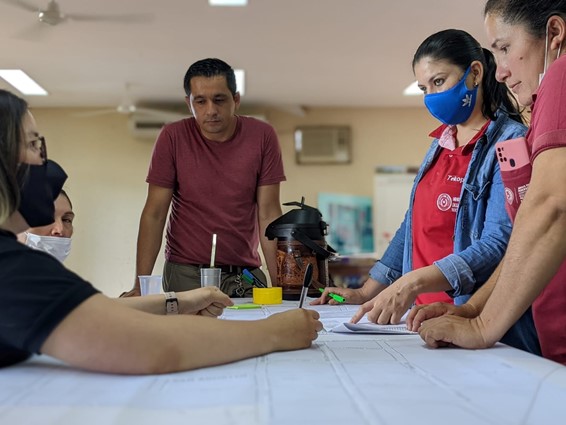
We feel confident about our methodology to evaluate impact of the intervention in the diversity of diets. There are many other variables we could have measured and analyzed, and the data we collected will surely allow for other forms of analysis. Particularly, we were able to articulate the cooperation of more than 3 different public institutions to create both the conditions and later facilitate the implementation of the experiment: the social development ministry contributed data on its social programs, the municipality of San Juan Nepomuceno gave the space to gather and map households to categorize census geo spatial data. It also provided the venue and facilitated spaces to discuss options of the intervention and later on, its results with the community. Moreover, the presidential delivery unit helped in all the activities, articulating contacts and opening doors for us to work with allies. As for limitations, we need to explore in the future the offer side. The local fair only offers its own production, which limited a little the spectrum of products available. Seasonal dynamics and the integration of other local fairs or community gardens into the control variables are things to explore. Census data is outdated (last census was in 2012, and was riddled with implementation issues as it happened in the context of political turmoil).
From design to results, how long did this activity take? (Time in months)
6
What were the actual monetary resources invested in this activity? (Amount in USD)
Approximated values are below, for each activity of the experiment. $2.200 = Characterization survey and baseline (data collection, in presence survey) $2.000 = Implementation, logistics and monitoring. $2.700 = Impact evaluation survey (data collection, in presence survey) $4.000 = Food stamps value $300 = Printing of food stamps and other materials $11.200 = Total cost of implementing and collecting data for the experiment $7.500 = Consultant that work throughout this learning cycle as our associate researcher in the field, designing, conducting, and articulating local actors for the implementation of the whole field research. Other resources: time invested by AccLab Members (average or 2h week over the full period of the learning cycle, with an increase to 8h-10h/week during the experiment), half time engagement of a the Social Innovation Coordinator from the Presidential Delivery Unit.
Learning
What do you know now about the action plan learning question that you did not know before? What were your main learnings during this experiment?
We know that increasing economic access to fresh vegetables and fruits produced locally has an impact on the dietary diversity. We have also learned how to design and implement the logistics, monitoring, and execution evaluation processes that are needed to deliver programs like the one we piloted, and after a series of co-creation workshops where we deliberated on the results, learned how rich and transferrable these processes are to other public services and programs for food security assistance. We learned how important it is for the lab members to be on the field before, during and after the experiment, in order to increase take up and achieve buy in. And finally, we could watch up close how a strong community organization such as the one that organizes the fair, can be a key partner in food security programs, creating opportunities to increase their productivity by establishing connection with these programs that can sustain a local demand for their products in both crisis times but also throughout the year when programs are of continuous delivery (e.g., the school lunch programs, for example).
What were the main obstacles and challenges you encountered during this activity?
Time. We had little time to both design and implement the experiment. The bureaucratic demands for delivery before the end of the year stressed us thin and limited the room for a good implementation.
Who at UNDP might benefit from the results of this experimental activity? Why?
Both our CO´s environment and inclusive development portfolios can benefit from both the lessons we gathered and the partnerships we were able to mobilize.
Who outside UNDP might benefit from the results of this experiment? and why?
All the partners involved in the experiment: (1) the Ministry of Social Development has expressed interest in transferring lessons from this experiment to their community gardens program that complements the direct monetary transfers they manage, (2) the Presidential Social Cabinet Delivery Unit has interest in learning from the articulations we mobilized to coordinate the multiple institutions they have to engage, (3) the Presidential Delivery Unit has developed and strengthened their R&D+innovation skills in the context of a public policy and social program issue, which will be key in their upcoming Public Innovation Program, and (4) the Municipality of San Juan gained insights into how to localize social program interventions, (5) the local fair increased their demand and was able to do so without renouncing to their principle of only offering their own products (6) FAO Latin America is prioritizing new approaches to food security, and the experience and evidence generated by this learning loop is unique not only in Paraguay, but in the region in general and could serve to orient UNDP-FAO collaboration.


 1No poverty
 2Zero hunger
 10Reduced innequalities


Comments
Log in to add a comment or reply.